More of us should familiar with Bayesian probability, in which you acknowledge your priors and update frequently.
In predictions and finance, the average is more often close to the best than to the worst. So figure if you really want to be average. Poker, chess, earthquakes and economics are either so varied or still missing some underlying sense for predictions to be especially good; in contrast to other weather and the emergence of collective wisdom.
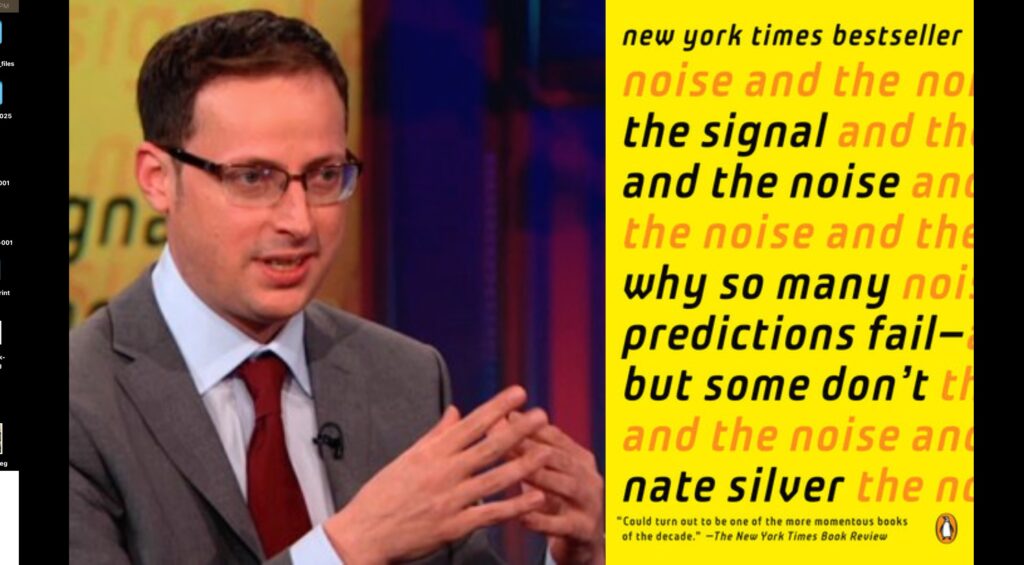
All that’s from the 2015 book “The Signal and the Noise: Why So Many Predictions Fail–but Some Don’t,” by pollster, odds-maker and very-online-person Nate Silver. This book was before Trump’s first election, and when Silver began his combative persona online. Back then, poker and gambling was a world of mathematical insights, presaging other books like one in 2018 by Annie Duke. It injected a kind of numeracy among the professional class, which was good, though we’ve been fighting against the numbers ever since.
As Silver, who was 37 when this book came out, wrote then: “This book is less about what we know then about the difference between what we know and what we think we know.”
Below I share my notes for future reference.
My notes
- The Printing Press rapidly changed the cost of a book from $20k in today’s money to $70 per book in today’s money
- Johannes Gutenberg invented the mechanical movable-type printing press in Germany around 1440. He perfected the machine for commercial use by roughly 1450, with the first major work, the Gutenberg Bible, completed around 1455
- A type made the Wicked Bible (1631): thou shalt commit adultery
- The explosion of information from the printing press drove violence, as overrun with information has us retreating into selective information
- The word “prediction” is Latin and mystical in origin; “forecast” is Germanic and more worldly grounded
- “The explosion of information produced by the printing press has done us a world of good, it turned out. It had just taken 330 years – and millions dead in battlefields around Europe – for those advantages to take hold.”
- “We faced danger, whenever information growth outpaces are understanding of how to process it”
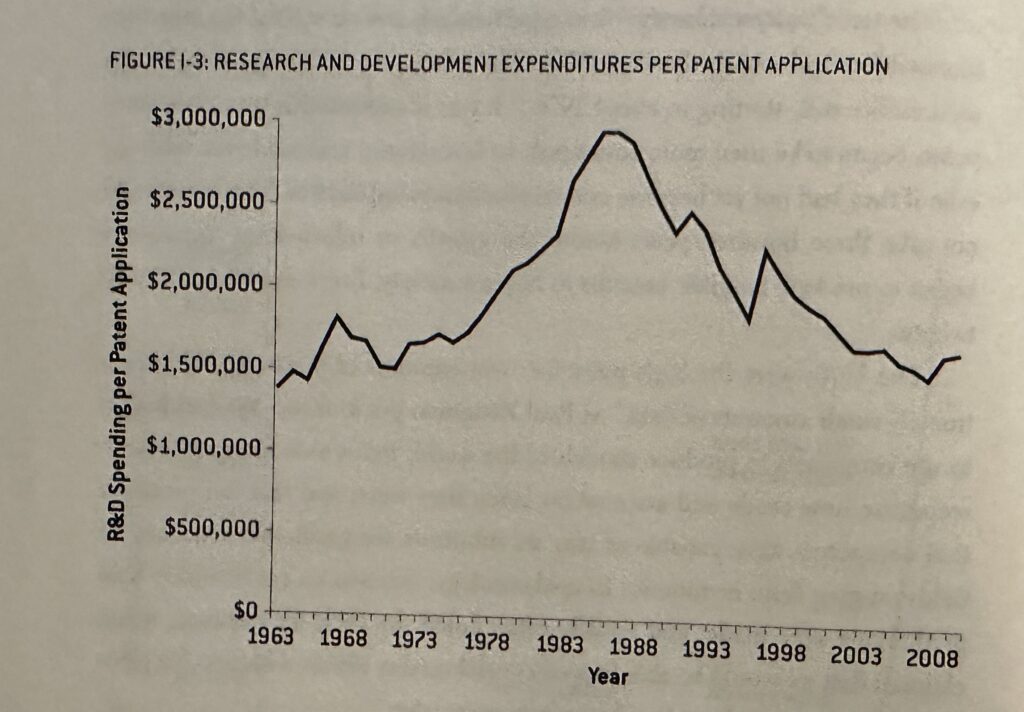
- Productivity paradox: decline in economic and scientific progress in 1970s and 1980s before boom
- Research and development expenditures per patent application (See chart from the book below)
- Tetlock: events that political scientists said had no chance of happening happened 15% of the time
- John Ioannids 2005 paper: why most published research findings are false
- Toffler 1970: information overload
- Karl popper: Making a prediction connects objective and subjective, and must be falsifiable
- “The noise is increasing faster than the signal”
- The Great Recession was “a catastrophic failure of prediction” (28% of CDOs defaulted but credit agencies had them at AAA to predicted 200 times less at 0.12% at likely failure fate)
- credit default CDOs; if you assume all the mortgages defaulting are independent of each other, it’s very unlikely they’d all fail. But in bad economic conditions, the entire country meant that defaulting was highly correlated
- In his seminal 1921 work, Risk, Uncertainty, and Profit, Frank Knight distinguished between measurable “risk” and unmeasurable “uncertainty,” arguing that risk is a probability that can be calculated and priced, often insurable, while true uncertainty involves unknown probabilities and explains the existence of economic profit: risk is what you can put a price on
- Uncertainty can’t be measured
- Case-Schiller: $10k into housing in 1896 was worth just $10.6k in 1996; no growth but stable
- In 2007, for every dollar of new mortgages, Wall Street made $50 with of bets on them
- George Akerlof’s 1970 lemon paper: the quality of goods will decrease in a market with asymmetry of information
- Fear and greed balance each other, Larry summers told the author in December 2009. If you have too much greed, you get a bubble. Too much fear, you have a panic
- Analyzed McLaughlin Group predictions, of 733 predictions, 249 weren’t clearly falsifiable, but 285 were completely true and 268 were completely false, 53 mostly true, 70 mostly false and 57 a mix
- Tetlock in 2005 expert political judgement: 15% of things analyzed experts said would never happen did; 25% of things they said were certain didn’t happen. His analysis was the fox is better than the hedgehog at predicting (hedgehog predicting worsen with more degrees and more info)
- Author’s 538 organization founding philosophy; be probabilistic; “today’s forecast is the first forecast of the rest of your life”; look for consensus
- When the facts change, I change my mind: Keynes
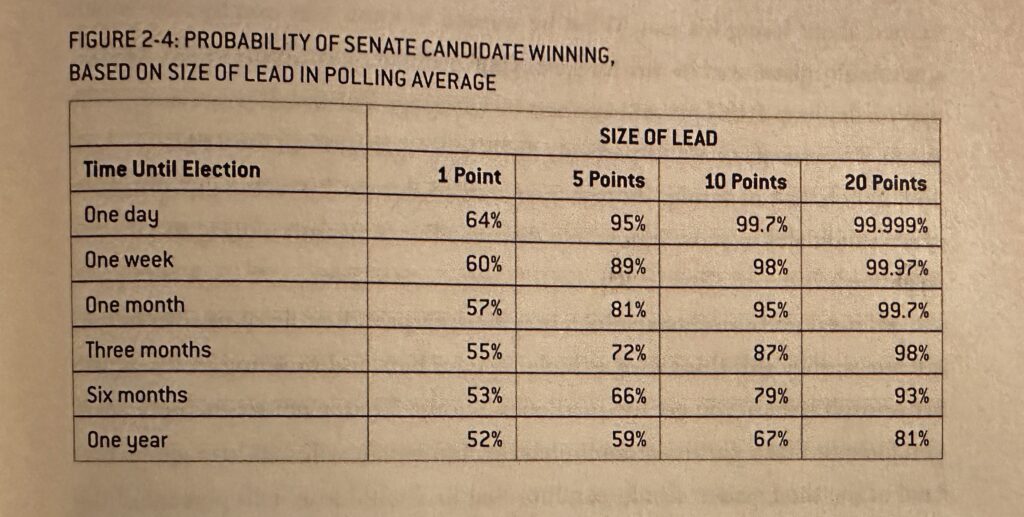
- See screenshot below of author’s table for “probability of senate candidate winning”

- For baseball players, Bill James’s development of aging curve was average (see below), Gary Huckaby added positional difference and author added more. You can see how averages hide enormous variation.
- His analysis: scouts (hybrid) forecasts were 15% stronger than stats only, 10 years after Moneyball was published in 2003 (sparking statistics-powered player management)
- Initial Moneyball era didn’t have good defense stats and so the statheads ignored it but later learned their bulky outfielders cost them 8-10 wins a season
- The debate over predeterminism versus free will represents a fundamental theological tension regarding how God’s sovereignty (predestination) interacts with human responsibility (free will). Augustine of Hippo and Calvinism emphasize God’s absolute sovereignty and unconditional election, often leading to a compatibilist view of free will. In contrast, the Jesuits (Molinism) and Thomas Aquinas seek to safeguard human free will, emphasizing that God’s grace works through human choices rather than overriding them
- Laplace’s Demon: with perfect information, could we make perfect predictions?
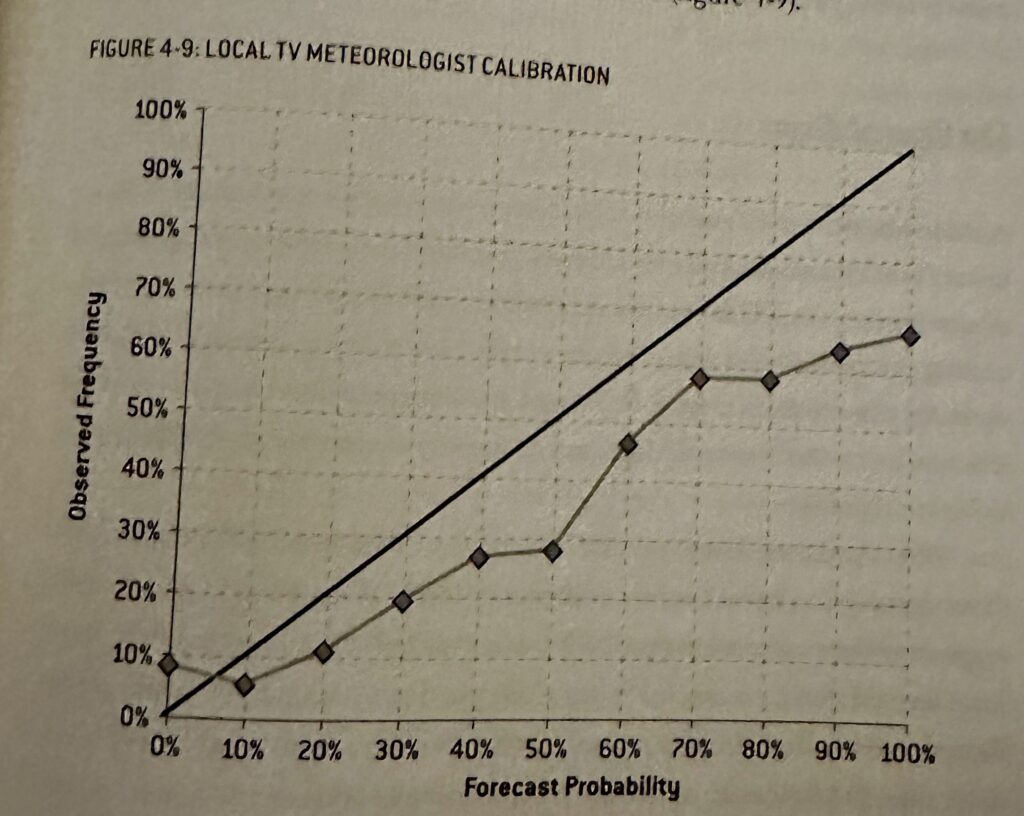
- Calibration of forecasts: of all your 40% forecasts, did they come true 40% of the time?
- National Weather sService forecast are well calibrated and still improving — but they admit they’ll default to saying it’s rain when it’s less sure because the sunny day is bonus (“wet bias”)
- Local TV news is far worse at predictions than what they could make for free because it’s not about accuracy (See below)
- Prediction is definitive; a forecast is probabilistic. The USGS says earthquakes can’t be predicted but can be forecasted
- Overfitting your model (a bunch of random noise can introduce more rules to prove previous outliers, which make it less helpful looking forward)
- The statistician drowned in a river that averaged three feet deep
- The 1997 Red River flood in Grand Forks, North Dakota, was exacerbated by a significant under-forecast by the National Weather Service (NWS), which predicted a 49-foot crest against levees that were built or reinforced to roughly 51–52 feet. The river actually crested at 54.35 feet on April 21, 1997, causing catastrophic, widespread flooding and forcing a massive evacuation.
- Robert Lucas in 1976: past economic data is also shaped by the policy decisions of the past
- Goodhart’s Law: once policymakers follow a metric, it loses its value (observer effect)
- Okun’s law: GDP growth and job growth related began to break down after Great Recession (Jeffrey Sachs: we underestimated global change on the U.S.)
- The Long Boom (just 15% years in recession) ended with the great moderation (3% recession) before Great Recession
- The 1976 swine flu immunization program launched by President Gerald Ford, following a feared pandemic that never materialized, significantly damaged public trust in vaccination and government public health initiatives. Rushed development, the absence of the predicted outbreak, and associated side effects created a lasting “fiasco”
- FIGURE 7-3: MEDIAN ESTIMATES OF R, FOR VARIOUS DISEASESS
- Malaria 150
- Measles 15
- Smallpox 6
- HIV/AIDS 3.5
- SARS 3.5
- H1N1 (1918) 3
- Ebola (1995) 1.8
- H1N1 (2009) 1.5
- Seasonal flu 1.3
But R only accurate after the transmission is widespread (because initially you only see the sickest and weakest, not representative of the whole population
- Bayes: probability of the sun rising approached 100%; David Hume says without certainty it never rises
- Bayes theorem: condition of the hypothesis variable; condition of the event if hypothesis is false and prior probability (algebra)
- RA Fisher was opposed to Baysian theorem, his frequentism rejected biased priors — but he became a paid tobacco consultant who denied links to lung cancer
- Claude Shannon’s 1950 paper on playing chess, weighing four strengths of computers against people
- Kasparov 1996 chess match against Deep Blue, which could calculate 200m positions per second. Kasparov could evaluate 3. Computers struggled with the beginning of the game because there were too many possibilities to calculate, whereas humans had conventional wisdom (control the center the board, keep your pawns organized)
- “Kasparov isn’t playing a computer, he’s playing the ghosts of grandmasters past” IBM’s own website said Deep Blue used a database
- Computers found unusual play through brute force; young Bobby Fischer found these same unusual moves (like sacrificing his knight) because he wasn’t too rooted in established heuristics that work most of the time. Grandmasters were steeped in the rules
- Poker is about better probabilistic decision making not short term results
- Predictions in competitive landscapes also requires your competition, and how far can Pareto principle of 20% of effort get you : the average predictor is offer closer to the top than to the bottom
- The Mathematics of Poker (2006 book by Bill Chen): a player who won $30k in first 10k hands in $100/$200 limit hold em is still more likely to be longterm losers
- Eugene Fama famous 1970 paper citing the idea of efficient markets: no individual picker beats the market over the longterm (chartists were those attempting to predict markets using charts of the past)
- Weak form: charts of the past don’t help
- Semistrong form: even new public info
- Strong form: even insider info gets priced in (risk adjusted)
- “How could stock prices be so predictable in the long run if they are so unpredictable in the short run?” Because competitive markets battle it out and price it in
- Thaler’s behavior economics criticism of Faima’s efficient market thesis: “No Free Lunch”they agree on but disagree on “The Price is Right” (whether mistakes happen)
- Fisher Black: 90% time markets are very right and otherwise they’re very wrong
- Tim Wirth opened the windows in the US Capitol building to make AC less effective for a hearing on climate change in June 1988
- J. Scott Armstrong, a Wharton School professor and renowned forecasting expert, authored the canonical text Principles of Forecasting (2001). In 2007, he challenged Al Gore to a $20,000 bet that global temperatures would not rise as projected by the IPCC, advocating for “naive” (no-change) models over complex climate modeling. (Gore didn’t take the bet, but Armstrong, who died in 2023, claimed in 2017 he would have won)
- 1990 IPCC predictions were too aggressive, revised down in 1995 and these have since held up reasonably well, author says
- Almost certainly greenhouse effect; very likely co2 emissions contribute but there is variability in the effects and the predictions
- Our military focus in 1941 was of sabotage from within, of our Japanese descendants and immigrants. We moved our Pearl Harbor fighter jets closer together so we could better watch for indivuaals to sabotage them. Of course this made the carrier air attack that had evaded our surveillance even more devastating
- Thomas Schelling, don’t confuse the unfamiliar with the improbable
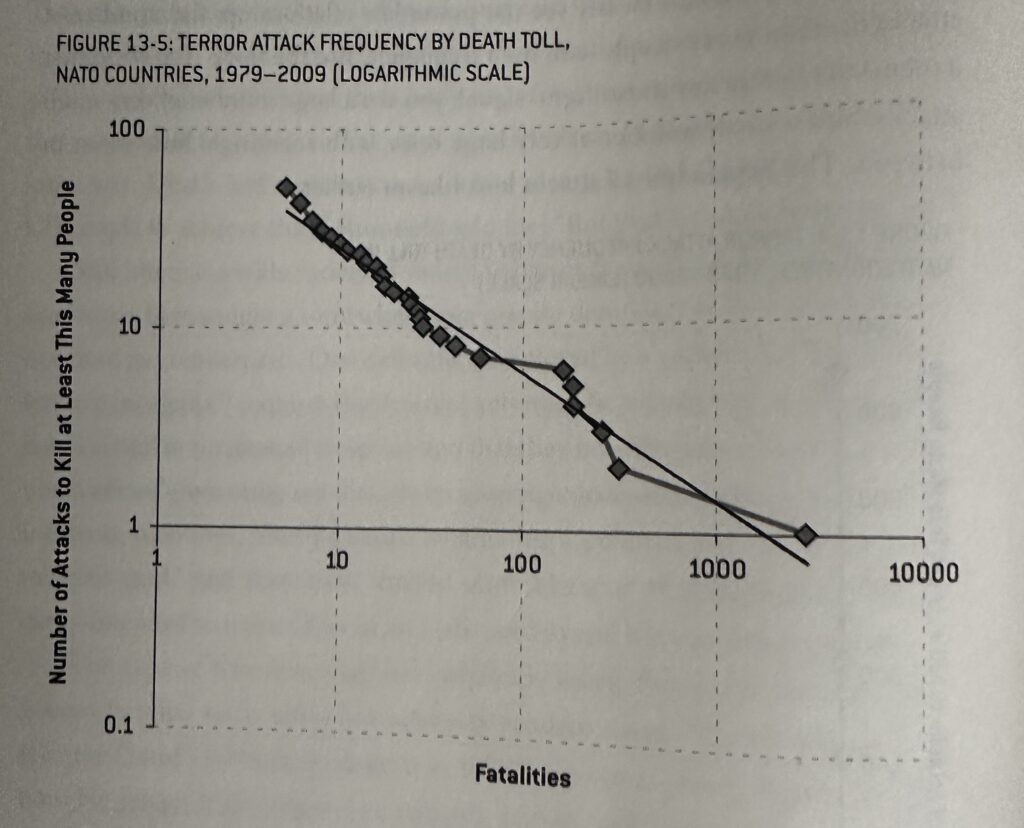
- Aaron Clauset: terrorist attacks follow power law in their distribution (like earthquakes , and vc hits) when charged in a double logarithmic scale, they create a straight downward trend (see terror attack death toll screenshot below)
- Derek Jeter dove for more balls but analysts found it was because he was actually slower — Ozzie Smith’s range would have made many of those plays look routine